Tough Projects Don't Last Though People Do!

I am a CS Student from Kaduna State University. A fellow of Click-On Kaduna Data Science Fellowship.
Every programmer has that one project that challenged them to their very core. Frustration, imposter syndrome, and several emotions set in. If you are a programmer, I'm sure you are smiling already because you can relate. If you have completed this project, great. If you haven't, do not worry you would be fine. It is probably a missing semicolon.
I have had my fair share of tough projects, some tougher than others. A few became abandoned projects because I didn't have enough knowledge of them before I started. However, "Admission Prediction" was one project I was not willing to give up on.
PROJECT BACKSTORY
In March 2021, I was determined to have an in-depth knowledge of the statistics and math that goes on behind machine learning algorithms. I bought a book " The Data Science Workshop " on Packt. The authors break machine learning concepts into minute understandable blocks. Most importantly, they explain the math and statistics behind machine learning algorithms. Chapter 2 explains how to build linear regression models using Statsmodels Formula API using the Boston Housing dataset. It seemed super easy and straightforward. Like a curious cat, I decided to pick a dataset and practice what I had learned. Little did I know this was going to be my most difficult project yet.
ADMISSION PREDICTION
The project was to build a model using Statsmodels Formula API that predicts the chances of a student gaining admission using GRE Score, TOEFL Score, etc. It seemed pretty straightforward. I got my dataset and got to work immediately. I carried out an exploratory data analysis first. To my amazement, I understood my dataset pretty well. The variance, skewness, kurtosis, and percentiles made sense to me. It was a proud moment for me.

TRAINING THE MODEL
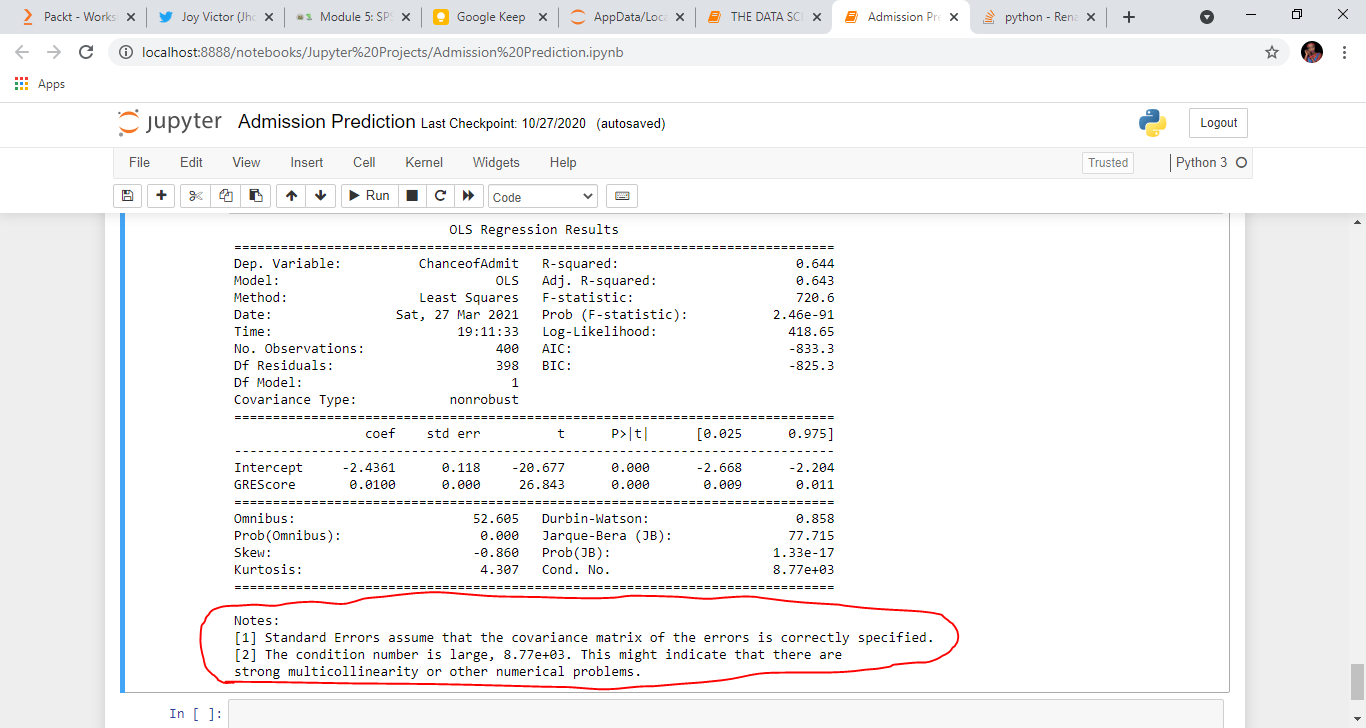
I decided to pick a variable and train the model, then add more variables to see their impact on the model. This was where the problem began. GRE score was the first variable I chose to train the model on. The results of the Statsmodels Formula API showed high multicollinearity within the variables. I tried other features, but I got the same result. This was not a good sign at all, here's why.
A linear regression model is a parametric algorithm that has the following assumptions:
- The relationship between the dependent and independent variables must be linear
- The residual terms must be normally distributed.
- The residual terms must have constant variance
- Multicollinearity must not exist among the independent variables
WHAT IS MULTICOLLINEARITY
When the independent variables are correlated among themselves, we have a problem called multicollinearity. This would lead to developing a model with coefficients that have values that depend on the presence of other independent variables. In other words, we will have a model that will change drastically should a particular independent variable be dropped from the model for example. A model like that will be inaccurate. Here's the tough nut, I understand what multicollinearity is and I know how to address with when it exists between two or more features but one feature? That I did not understand.
THE QUEST FOR HELP
I tried to find where the problem was coming from. I went back to study the book, it clearly stated multicollinearity exists between two or more variables. Why does my result show multicollinearity in a single variable? It shouldn't be possible. I studied more statistics than I had ever done in my life during this period. The closer I felt I was to the answer, the more confused I got. Two days after my silent struggle, I decided to ask for help.
LESSONS LEARNT
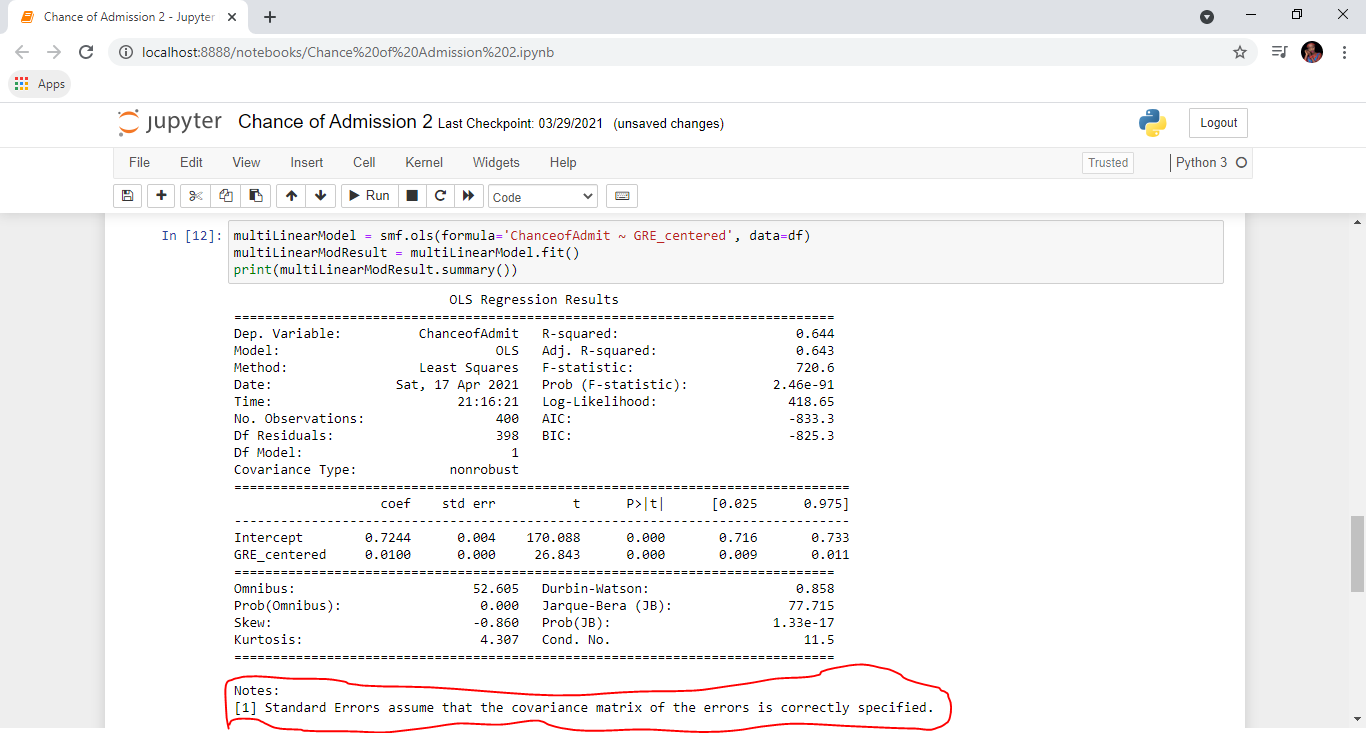
1. Centering data: Centering data simply means subtracting a constant from every value of a variable. What it does is redefine the 0 point for that variable to be whatever value you subtracted. It shifts the scale over but retains the units. If zero is not within the data set you have, your data may not have any real meaning. Let's say we center X so there is a zero value, it now has meaning and allows for interpretation. The GRE Score variable has a minimum value of 290, meaning it has no zero value. I centered the variable by subtracting the values from the mean, and this removed the multicollinearity.
2. Asking for help: When asking for help from someone you feel has more knowledge about the problem, show the person you have put in the effort to solve the problem before asking for help. Another tip would be to give the person the whole idea of the problem. Send your codes and dataset (if possible) so the person helping has a full idea of what you are doing. This would also improve your chances of getting your problem solved. I asked a lot of people for help when I was working on this project and I am grateful for their input. However, Dr. Siphu Langeni (Author of Tortus a Python Package) proffered the solution that solved my problem. I can attribute this to the fact that I sent my dataset and notebook to her (she requested them). This gave her a more holistic view of the problem.
3. Statistics is not the enemy: For the longest time, I did not enjoy statistics. The "jargon" was far too complicated for me to understand(so I thought). This challenge forced me to learn statistics. Now that I have a better understanding of statistics, it has helped me greatly in building models and understanding the intuition behind a lot of processes.
4. Share information: Whenever you understand a difficult concept or solve a problem try to share the information. You'll be shocked by the number of people that needed this help. It also helps reinforce what you've learned.

In the spirit of sharing, I decided to write this article and share my code. You can check it out here. Thank you for reading!


